NYSE Composite Index – Latest Development
by WaveTrack International| November 6, 2018 | No Comments
NYSE Composite Index – Fib. 100% Equality Ratio in Waves (iii) – (v) – No ‘Extended’ Wave
The Elliott Wave pattern development within the third phase of U.S. stock index declines during September/October’s sell-off varied according to each index’s performance from earlier this year. For example, the large-caps like the SP500 and Dow Jones (DJAI) declined into three wave patterns. In zig zags to be precise, from the late-Sep./early-Oct. highs as wave [c] within a developing triangle. These lows terminated in late-October but above the February lows. In this way reflecting their outperformance during April’s strong advances that broke above the January highs.
Other indices like the underperforming Russell 2000 small-cap index declined during September/October’s sell-off into a five wave impulse pattern. This reflected its underperformance and an entirely different corrective pattern. In this case, a running flat, unfolding from last January’s high.
The NYSE Composite index was one of the underperforming indices for this year. It unfolded into a zig zag pattern, [a]-[b]-[c] and one of the exceptions by breaking below the Feb’18 lows in wave [c] ending at 11820.32 – see fig #1.
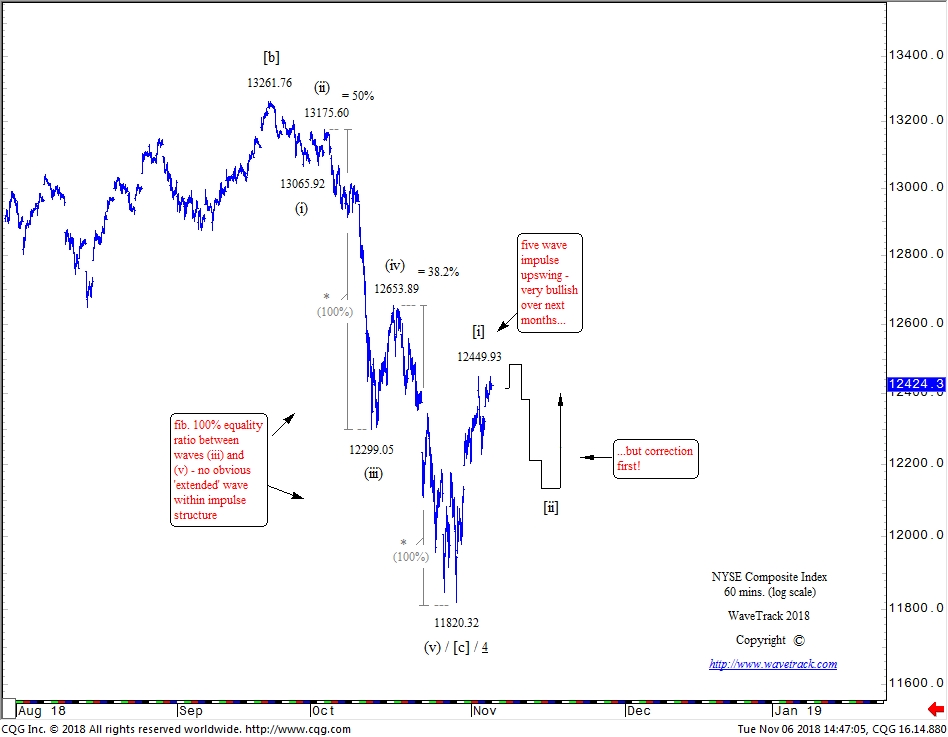
NYSE Composite Index – 60 mins. – www.wavetrack.com
Wave [c] unfolded into a necessary five wave impulse pattern from September’s high of 13261.76 subdividing (i)-(ii)-(iii)-(iv)-(v). What was interesting from a Ratio/Proportion basis was that there was no ‘extended’ wave in this sequence. Rather, waves (iii) and (v) measured equally by a fib. 100% equality ratio. That’s somewhat unusual because R.N. Elliott stated that one wave must ‘extend’ or measure larger than the other two. But occasionally, this hasn’t occurred as this example proves. Although this is statistically uncommon, it’s enough to qualify his statement as a ‘guideline’ rather than a ‘rule’.
NYSE Composite Index – Looking Ahead
With this year’s zig zag decline out of the way, the NYSE Composite index, like the others, can now begin a multi-month recovery, extending the bull market, impulse uptrend that began from the Feb.’16 lows.
Shorter-term, the advance from 11820.32 has unfolded into an intra-hourly five wave impulse pattern ending last Friday at 12449.93 as minuette wave [i]. Wave [ii] has since begun a three wave counter-trend correction but this remains incomplete. Await some downside pull across the U.S. mid-term election results before the trend resumes higher.
Comments

Recent Posts
Recent Comments
Archives
- April 2024
- February 2024
- January 2024
- December 2023
- August 2023
- July 2023
- June 2023
- March 2023
- February 2023
- January 2023
- December 2022
- November 2022
- October 2022
- August 2022
- July 2022
- June 2022
- May 2022
- March 2022
- February 2022
- January 2022
- December 2021
- August 2021
- July 2021
- June 2021
- March 2021
- February 2021
- January 2021
- December 2020
- November 2020
- August 2020
- July 2020
- June 2020
- May 2020
- April 2020
- March 2020
- February 2020
- January 2020
- December 2019
- October 2019
- September 2019
- July 2019
- June 2019
- May 2019
- April 2019
- March 2019
- February 2019
- January 2019
- December 2018
- November 2018
- September 2018
- August 2018
- July 2018
- June 2018
- May 2018
- April 2018
- March 2018
- February 2018
- January 2018
- December 2017
- November 2017
- October 2017
- September 2017
- August 2017
- July 2017
- June 2017
- May 2017
- March 2017
- February 2017
- January 2017
- December 2016
- November 2016
- October 2016
- September 2016
- August 2016
- July 2016
- June 2016
- May 2016
- April 2016
- March 2016
- February 2016
- January 2016
- December 2015
- November 2015
- October 2015
- September 2015
- August 2015
- July 2015
- June 2015
- May 2015
- April 2015
- March 2015
- February 2015
- January 2015
- December 2014
- November 2014
- October 2014
- September 2014
- August 2014
- July 2014
- June 2014
- May 2014
- April 2014
- March 2014
- February 2014
- January 2014
- December 2013
- November 2013
- October 2013
- September 2013
- August 2013
- July 2013
- June 2013
- May 2013
- April 2013
- March 2013
- February 2013
- January 2013
- December 2012
- November 2012
- October 2012
- September 2012
- August 2012
Categories
- ADXY Index
- Agnico Eagle Mines
- Alcoa
- Amazon
- AngloGold Ashanti
- APPL
- Apple
- ASX 200
- AUD vs USD
- AUDNZD
- AUDUSD
- Australia ASX 200
- Baltic Dry Index
- Banking
- Base Metals
- Biotechnology
- Bitcoin
- Bovespa
- Catalexit
- central banks
- Christmas
- Commodities
- Commodities Video Outlook 2020
- Conference
- Copper
- Coronavirus Sell-Off
- CRB
- Crude oil
- crude oil price chart
- CryptoCurrency
- Currencies
- Cycles
- Dax 30
- deutsche bank
- Dewey Cycle
- DJ Transportation Average
- DJ Utilities
- Dow Jones 30
- Dow Theory
- ECB
- economy
- Elliott Wave
- Elliott Wave Charts
- Elliott Wave Patterns
- Elliott Wave Principle
- Emerging Markets
- Ending-Diagonal Elliott Wave Pattern
- Equity
- EUR vs CHF
- EUR/USD
- Euro / US$
- Eurostoxx 50
- EuroStoxx50
- EuroStoxxBanks
- EURUSD
- Expanding Flat Pattern
- FAAMG
- FANG+
- fib-price-ratio
- Fibonacci Trading
- Fibonacci-Price-Ratio
- Financial Forecasting
- Fixed Income
- forex
- FTSE 100
- Fund Management
- FX
- FXStreet
- GBP/AUD
- GBP/USD
- GDX
- GDXJ
- Germany 10 year Euro Bund future
- Gilead Sciences
- Global Economy
- Gold
- Gold Mining
- Golden Ratio
- goldman sachs
- Google Inc.
- Greek debt crisis
- Hang Seng
- Harbinger
- Hungarian Forint
- IBEX 35 Index Spain
- Independent Research
- India-CNX Nifty 50
- Interest Rates
- Interview
- IRP Independent Research
- kbw bank index
- Lonmin
- McDonald's
- MID-YEAR VIDEO UPDATE!
- Mifid II
- Mines
- Mining
- MSCI China
- MSCI Emerging Markets
- Nasdaq 100
- Nasdaq Biotechnology Index
- Nasdaq Composite
- Nasdaq100
- Nikkei 225
- NYSE Composite Index
- Palladium
- Platinum
- Precious Metals
- Ralph Nelson Elliott
- Reversal-Signature
- Russell 2000
- Russia RTS
- S&P 500
- Sector
- Secular-Bull
- Sentiment Survey
- Shanghai Composite Index
- Silver
- Slanting Flat Elliott Wave Pattern
- SP100
- SP400 Mid-Cap
- SP500
- SPX 500
- STLG/AUD
- Stlg/US$
- STLG/USD
- STLG/YEN
- STLG/ZAR
- Stock Index
- Stock Index Tracking
- Stock Index Video
- Stock Indices
- Stock Indices Video Outlook 2023
- Sugar
- Summary
- Tesla Inc
- Toyota
- Track Record
- trading
- Trusts
- Tutorial
- Uncategorized
- UniCredit
- US
- US Dollar Index (DXY) (USDX)
- US$ Index
- US-Dollar Index
- US10yrYields
- USD
- USD/ARS
- USD/CNY
- USD/IDR
- USD/INR
- USD/MXN
- USD/SGD
- USD/THB
- USD/YEN
- USD/ZAR
- Value Line Index
- video
- VIDEO OUTLOOK 2018
- VIDEO OUTLOOK 2020
- VIX
- W.D. Gann
- WaveTrack International
- XAU Gold/Silver Index
- Xetra Dax
- XOP
- Yields
- Zig Zag
- Zinc
- ‘INFLATION-POP’
- ‘SHOCK-POP-DROP’
