Stock Markets begin multi-month decline
by m.tamosauskas| August 5, 2014 | No Comments
Dear Elliott Wave Enthusiasts,
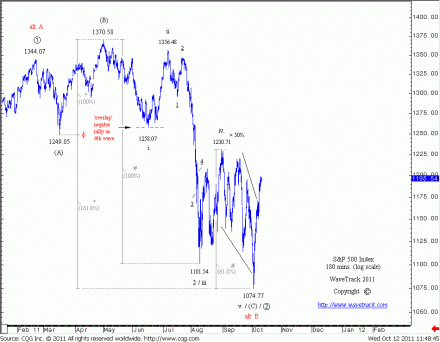
Stock markets have finally staged a reversal [sell] signature late last week to confirm the S&P 500’s upside completion of intermediate wave (3) that began from the June ‘12 lows. Many of you that have followed our Elliott Wave price forecasts for the last several years will know that our last major ‘buy-signal’ of Oct.’11 exactly pinpointed the S&P’s low at 1074.77 through a combination matrix of Fibonacci-Price-Ratios (FPRs) – go back in time and see that chart and accompanying text below:
Elliott Wave Update: October 12, 2011
“The early October low at 1074.77 traded exactly to measured downside targets (at 1074.82)…other major indices such as the Dow Jones did not exhibit ‘overthrow’ and when cross-correlated to the NYSE Composite index, the depth of the final decline below the August low measures too far to be anything else other than completing a diagonal. Therefore, the structure of the decline and its overall form together with measured amplitude targets being met provide convincing evidence that a significant low has already ended the May ’11 decline”.
This marked the beginning of a multi-year advance as cycle wave C that in fact, is still working its way higher.
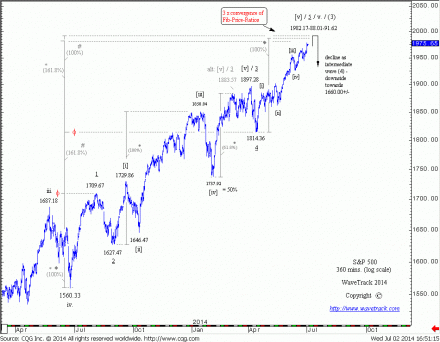
Now fast-forward to July 2014 – the recent high recorded the S&P 500 at 1991.39 on July 24, and this formed a ‘triple-convergence’ matrix of Fibonacci-Price-Ratios (FPRs) measuring the impulse upswing from the June ’13 low – see next chart:
Last week’s sell-off that has now traded down to 1925.00 is only the beginning of a sustained multi-month corrective decline as intermediate wave (4).
The importance of applying Fibonacci-Price-Ratios (FPRs) to the evolving Elliott Wave structure of any developing pattern is paramount in the evaluation, identification and execution of any investment strategy. Relying on an arbitrary wave labelling without applying the correct matrix overlay is like jumping out of a plane without a parachute – and how daft is that?
Mainstream Elliott Wave analysis continues its long-term perma-bear theme, as it has done for the last few years – however, the guidelines of Fibonacci-Price-Ratios (FPRs) have provided a reliable bullish outlook during the same period. Only now does this change. A period of regression has begun but the application of FPR’s within the Elliott Wave structure of the entire advance from the Oct.’11 low suggests this is simply another corrective decline that will later be followed by higher highs.
Just look at what is going on in Asian stock markets and this fact becomes realistic. Asian markets have underperformed since Oct.’11 with some yet to even break above the pre-financial-crisis highs – that will occur next year though – but first, a hefty corrective decline must unfold beforehand!
All of these global markets are updated in our twice-weekly publication of the Elliott Wave Compass report. Furthermore, we published the medium and long-term wave counts for Global Stock Markets, Currencies, Interest Rates & Commodities in our latest video series – view PART I & PART II absolutely FREE when you subscribe to the EW-Compass report.
Very best wishes,
Peter Goodburn
Senior Elliott Wave Analyst


