Global Stock Index Tracking
by WaveTrack International| April 5, 2016 | No Comments
86% of Active Equity Funds Underperform – Can Global Index Tracking Reverse this Figure?
A recent survey of 25,000 ‘active’ equity funds has revealed that firms based in Continental Europe, almost all underperformed their benchmark index over the past decade. A figure of 80% per cent underperformed over the past five-year period, rising to even higher levels in the Netherlands, Switzerland and Denmark.
The research by S&P/Dow Jones Indices also showed that 98.9% per cent of U.S. equity funds underperformed their benchmark over the last ten-year period as did 97% per cent of those specialising in Emerging Market funds and 97.8% per cent for those managing Global Equity funds.
U.K. active equity funds fared better by comparison, outperforming over a 1-3-5 year period but over 10-years, all categories underperformed.
These latest statistics are nothing new to the active vs. passive fund management debate on efficiency – it’s been hotly contested for the last decade and longer. There are trade-offs for both methodologies of course. Investing in ‘active’ equity funds enables managers to be agile in manging portfolios in an environment where price volatility has increased during the last decade-and-a-half. Passive funds attracts lower fees for the investor.
What can we glean from this survey?
A few aspects come to mind.
- The efficiency of active equity funds would not be debated if they outperformed the index, after fees, on a more regular basis.
- Over a ten year assessment, nearly all funds underperform – this is most probably due to the fact that it encompasses the period of the financial-crisis sell-off during 2007-09 – and yet, the percentage figures are still incredibly high over the 5-year sampling.
- It is driving investment out of active equity funds and into the low-cost exchange traded fund market which has a six-fold increase over the last decade to $2.9tn dollars.
But the real question remains not of underperformance per se, but its cause/s. Is this because of poor stock-picking? – if so, is the analysis underperforming? – if not, are there other causes such as the difficulties in adapting to high volatility in a non-trending environment? Maybe.
Can this underperformance trend be reversed?
Yes, it can. But first, it’s important to understand the real reason for underperformance. It doesn’t necessarily lie in the re-evaluation of bottom-up equity research consumed – it lies in the ability of individual fund managers to extricate themselves from the instinct of herding. This is imperative in an environment that is much more volatile than in previous decades. ‘Herding’ is the tendency for individuals to mimic the actions of the larger/aggregate group.
As Albert Phung explains: ‘There are a couple of reasons why herd behaviour happens. The first is the social pressure of conformity. You probably know from experience that this can be a powerful force. This is because most people are very sociable and have a natural desire to be accepted by a group, rather than be branded as an outcast. Therefore, following the group is an ideal way of becoming a member. The second reason is the common rationale that it’s unlikely that such a large group could be wrong. After all, even if you are convinced that a particular idea or course or action is irrational or incorrect, you might still follow the herd, believing they know something that you don’t.
It’s only natural that a majority get engulfed within the ‘group-think’, more now than ever because of the sheer amount of information that we consume via e-mail, social media and financial news providers. But it’s a trap! When markets are trending, yes, an established momentum of optimism occurs, probably but not always, resulting in outperformance of the index. But when markets come to a point of ‘exhaustion’, usually when few expect it to, then human instinct clicks in. Once benchmark indices trade lower, in any meaningful way, equities invariably follow lower too. During these declining phases, even though many equities may match the index in percentage terms, the fund manager that is herding is likely to get caught-up in executing at levels of stress when the equity is momentarily underperforming because everyone else is doing the same thing at the same time!
And there’s been plenty of those severe pullbacks in the stock markets over the last few years. Taking the S&P 500 index as a benchmark, there’s been three such sell-offs during the last 18 months alone – minus -9.8% per cent in September ’14, -12.4% per cent in July ’15 and more recently -14.4% per cent last November ’15. This excludes the larger decline of May ’11, -21.6% per cent and a few others in-between.
So how can we extricate ourselves from getting too caught up in herding?
One answer lies in the practice of de-herding – becoming more independent in thought and process. This doesn’t mean becoming a fixed ‘contrarian’, but at important inflexion points, yes, it becomes an essential quality to adopt. To do that, it is important to rely on some ‘anchors’ that will support us during stormy times. These anchors are certain laws that define financial markets that in turn, govern the price development of all indices and equities. These laws reverberate causing certain repetitions of market behaviour – this allows them to be monitored, tracked and even used to forecast future price development. These laws become very apparent through volatile times, like the period of the financial-crisis. The lows in March ’09 were predictable basis these laws. It takes time though, to build a ‘belief’ system in these anchors and everyone will be different in their assessment of such knowledge. But to those that can withdraw from the financial ‘noise’, great benefits await!
The anchors/laws are as follows:
- Market price activity alternates in periods of ‘action’ followed by ‘reaction’, ‘trend’ and ‘counter-trend’
- Historical price activity has a direct relevance/impact to its future development – know the past and the future becomes predictable
- Price activity forms recognisable ‘patterns’ that repeat over and over again
These patterns form in a specific sequence and are not random events
Varying patterns are limited to 13 basic formats that encompasses all market activity - These patterns form consistently and repetitively throughout many time-series – they can be observed spanning many decades or evolving within several minutes (fractal in nature) of price activity
- Pattern size/amplitude of price development is governed by its relative association within its peer/corresponding group – this means it is hierarchical in nature, forming larger/aggregate patterns with self-similar components and sub-components
- The size/amplitude of price activity/patterns can be measured using specific Fibonacci-Price-Ratio (FPR) measurements – these often produce accurate target levels calculated into the future
Most important of all, once an understanding of these laws/principles is obtained, it must be practiced – but only belief can instil its effectiveness. Fear must be overcome and that only visits us during times of extreme stress, when peer sentiment is wreaking havoc! But that is precisely the time to become the contrarian! A good example of this was when Warren Buffet began to buy equities, specifically, the banks near the lows of the financial-crisis in year-2009. Almost everyone else was selling. The outcome we know.
This was an extreme case of bearish sentiment of the time – if it could be reliably measured, it would probably read 80/100, a hundred being the worst case of pessimism or despondency on record (Great Depression, 1932?). There are different magnitudes of this condition too, and it’s opposite, optimism and euphoria. The sentiment measurement will be less in smaller percentage declines/advances. For example, what about the recent event in January/February ’16? Could the low traded in early/mid-February be predicted?
Could this have prevented underperformance of the underlying index? – Yes, Yes!
The global indices of the world markets are excellent proxies in tracking the overall trends of sector/derivative equites. Know how these perform, trend, and you have a pretty good idea if top-down, your equity is going to suddenly fall off a cliff, or be the defensive king!
Our methodology of using the anchors/laws is commonly known as the Elliott Wave Principle (EWP). It’s dynamic in nature and application – over the last 25 years, we’ve developed a proprietary way of measuring all the patterns identified by its discoverer, R.N. Elliott (1871-1948). This assists in the objective assessment of pattern identification. For example, using these laws, the underlying stock market sell-off in February ’16 was expected to finalise an important low – even though consensus at the time was very bearish with mainstream headlines/analysts calling for continued declines –
o January 29 – This reliable indicator says we’re in a bear market for stocks
o February 12 – JP Morgan Warns Upcoming Recession
o February 25 – Smart-beta guru is now warning of a crash
o February 29 – Investors pull more than $60bn from mutual funds
Contrastingly, major indices were forecast as forming an important low:
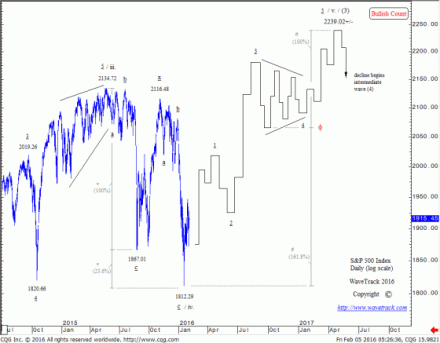
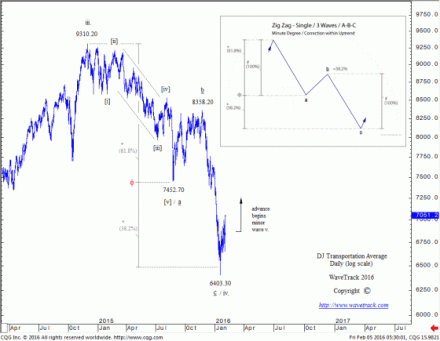
WaveTrack Report, February 5 – ‘Despite consensus pessimism throughout the stock market, especially since the banking sector is still working itself lower, there exists signs of an emerging recovery. Should shorter-term overhead resistance be overcome, it would signal a more sustained advance unfolding for the next several months with price targets to last year’s highs, and eventually beyond’. See fig’s #1 & #2 from that report:
Start Index Tracking today! Get access to WaveTrack’s bi-weekly Elliott Wave Compass report featuring many short-term updates of various asset classes and three exclusive videos!
Successful trading with WaveTrack International
Subscribe to the EW-Compass here…


