SP500 – Drama, Declines & Opportunity!
by WaveTrack International| February 12, 2018 | 9 Comments
DIARY OF AN ELLIOTT WAVE ANALYST
SP500 – A WEEK OF DRAMA, DECLINES & OPPORTUNITY!
It was a week of drama, declines & opportunity for SP500. But it all began several days before, on Friday 26th January. The SP500 index was testing upside targets of 2861.75+/-, eventually overrunning slightly to 2878.50 (futures) first thing Monday morning. It then spent most of the week working lower. However, importantly unfolding into an intra-hourly five wave impulse pattern to 2813.00 ending a 1st wave in the process. Evidence of a five wave impulse pattern ensured downside continuity once a short-term correction had completed. And that’s exactly what happened by Thursday night when the index ended a 2nd wave correction at 2836.75. From then on, it was all downhill. Friday’s trading saw the SP500 decline in a 3rd wave sequence ending at 2755.00. On Monday, the 3rd wave ended at 2733.00 followed by a 4th correction to 2763.00 by the time the U.S. markets began trading. The 5th wave collapsed into Monday’s session to 2596.00, then extended into Tuesday’s low at 2529.00.
SP500 – Could such huge declines really be predicted?
Well, yes, why not. Perhaps the speed of the declines were not necessarily predicted unless you are familiar with the principle of VELOCITY in financial markets. If you’ve stared and studied such phenomenon in the past, you will begin to see! Understand that when any market runs higher, exponentially, upon exhaustion, it will decline by an equal or often larger velocity. That was certainly the case here.
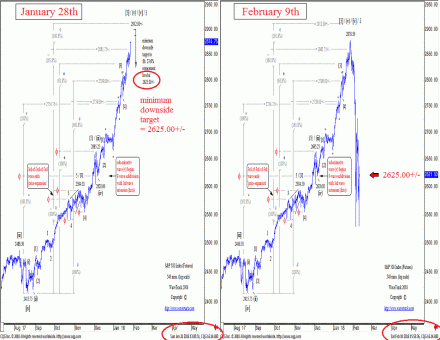
In Friday’s January 26th Elliott Wave report, the SP500 was forecast building an important high towards the 2861.75+/- area. But then beginning a multi-month correction with minimum downside targets towards 2625.00+/-. This happened to be the fib. 23.6% retracement of minute wave 3’s advance measuring from its origin, the June ’16 Brexit low. Soon enough, the collapse gathered pace as last week’s trading began. Subsequently, resulting in reaching this downside target in short succession! – see Track Record in fig #1.
The Imporance of Correlations
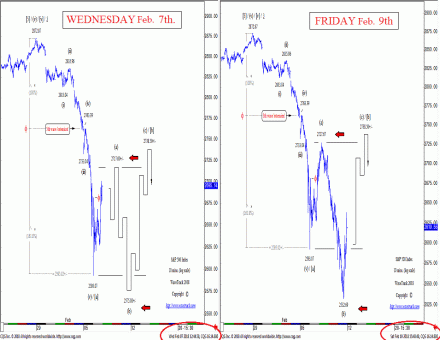
Cross-referencing the decline with various other global indices, a synchronous pattern began to emerge. Monday/Tuesday’s rapid, accelerative declines was actually a 5th wave that was undergoing an ‘extension’, where one of three impulse sequences within a five wave pattern unfolds much larger than the other two. We could ‘proof’ that through fib-price-ratio analysis – for example, a common ratio found in 5th wave extensions is where it unfolds by a fib. 161.8% ratio of the 1st-4th waves – see fig #2. This projected a low for the 5th wave towards 2595.02 (cash index) – the actual low was 2593.07!
When 5th waves ‘extend’ like this, it commonly results in a hefty corrective upswing that follows, once again, the VELOCITY principle at work. During Wednesday’s session a three wave corrective sequence was forecast in our Elliott Wave report ending towards 2717.00+/-, the actual high was at 2727.67!
The ‘Compensation’ Factor
But because the preceding decline was an extended 5th wave plus the fact that the market’s emotions were running high, another principle was enacted – that of ‘COMPENSATION’. It’s function is to allow the market’s behaviours and emotions to ‘catch-up’ with the volatile price movements, and that often translates itself into a correction which unfolds as a ‘complex’ pattern, i.e. a horizontal/expanding flat, or perhaps a triangle. The subsequent trading-range created by such patterns allows the market’s behaviours and emotions to ‘digest’ the recent volatility. Our analysis reflected this too in Wednesday’s forecast for the S&P 500 to unfold the correction into an expanding flat pattern – labelled wave [b]. This required a decline from 2717.00+/- [2727.67] to a slightly lower-low, estimated down towards 2575.00+/-, [actual low was 2532.69] but then a hefty upside recovery that begins its final sequence, targeting upside levels towards 2738.50+/-. You can see how effective this forecast was into late-session Friday. The SP500 (cash) swing dramatically higher ending at 2619.55 – and this advance is by no means finished yet.
SP500 and Futures Contracts
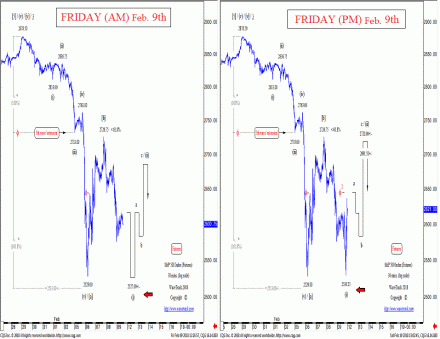
Friday’s Elliott Wave report forecast this same decline, then reversal upswing for the SP500’s futures contract – see fig #3. The same five wave impulse pattern ended wave [a] into Tuesday’s low, but the following upswing to 2726.75 ended the entirety of wave [b]. The following decline actually begins the 1st wave within wave [c] declines, and in the morning, this was still incomplete with downside targets towards 2527.00+/-. This downside target was measured from the internal five wave development of this decline, where the fifth wave unfolds by a fib. 61.8% correlative ratio of the first-third waves.
Fast-forward to the evening session of Friday, the SP500 ran lower amidst nervous selling and a lot of bearish headline media reports, but within a few hours of the close, the SP500 hit a low at 2530.25, just a few points from ‘idealised’ target levels, then popped higher to begin wave [c]’s 2nd wave rally.
This coming week is expected to be a very positive week with more upside potential.
These price-forecasts are dedicated to R.N. Elliott’s work and discoveries – Peter Goodburn
PS: All of this has been forecasted in WaveTrack’s EW-COMPASS REPORT
For Stock Indices Traders
Single Video – $48.00* *(additional VAT may be added depending on your country of residence. Currently US, Canada, Asia have no added VAT but most European countries do) – PART I – STOCK INDICES (54 charts 2 hours long) (Dec. ’17/Jan. ’18) Table of Contents for the STOCK INDICES VIDEO
Are you trading Currencies – SP500, Nasdaq 100, Russell 2000, Dow Jones 30, EuroStoxx, Dax, FTSE100, Shanghai Composite, Hang Seng or ASX200? Don’t miss WaveTrack’s regular updates in our bi-weekly EW-Compass Report! Ensure you’re tracking our Forex forecasts – subscribe online for the EW-COMPASS REPORT.
Visit us @ www.wavetrack.com and subsribe to our latest EW-COMPASS report!


